
Financial literacy has always tested what children know. We measure how they decide.
The FLIQ Score™ is a financial literacy assessment that measures decisions, not recall: the Financial Literacy Intelligence Quotient, produced by the FLIQ Score Model (FSM) and read before and after a program.

- 8 dimensions
- 117–936 scale
- Matched pre/post
- Longitudinal follow-up
- No student ranking
No child is ever labeled by a number. Students see a badge and how far they have moved, never a rank. The score measures a program, not a verdict on a child.
All scores and figures on this page are illustrative examples, not pilot results.
Understanding the score
One index. Five stages.
The number districts act on isn’t the level — it’s the change. A cohort that moves 529 → 687 tells you what a semester bought, whether or not you’ve ever seen this scale before.
529 → 687+158
Developing (Builder) → Advancing (Thinker)
A profile, not a grade.
Eight domains, read before and after. The profile shows not just whether a reading moved, but where. Leaders see the change, the score, and all eight areas. Students see only their badge.
Earning. How money is made, and what it costs to make it.
Spending. Judging what is worth it, and what isn't.
Saving. Holding back now for something later.
Giving. Deciding what to share, and why.
Borrowing. Understanding what is owed before agreeing to owe it.
Investing. Putting money to work, and weighing the risk.
Protecting. Guarding what you have against loss.
Planning. Sequencing choices toward a goal.
Move the slider
What each stage looks like in a child
Weighs the trade-off before deciding, not after. Sets a goal and adjusts when something changes.
A single reading is a starting point, not a verdict. The number a school acts on is the distance between two readings.
What the student sees
OperationalThe question every district eventually asks: did it work? Here is how we will answer it.
Free programs can show engagement. The FLIQ Score™ is designed to observe decisions, in the room, in the world, and at home: the start of an answer, not yet the answer.
What this looks like on a Tuesday.
You do not administer the FLIQ Score™. You run the lesson, and the measurement happens underneath it: no extra test, no extra prep, and your class view shows movement before any report goes upstream.
The worksheet is only the beginning.
The Real-World Capstone™ is the moment a student does it for real: launches a small business, makes a first investment, gives to a cause. The FLIQ Score™ is designed to capture that first revealed behavior, the leap a quiz cannot show.
The real test is at home.
iPARENTS™ is designed to extend the FLIQ Score™ to what happens at home, where a lesson either takes hold or fades. In development.
How it works
OperationalFour things make the number.
The FLIQ Score Model (FSM) reads what a child actually decided across eight areas of money, and trusts a domain more the more it has seen. Verified actions outside the simulation count for more, within a cap, and the result is calibrated to one index from 117 to 936 in five bands. Scoring runs server-side, not in the student’s browser; the structure of the model is published and its coefficients are withheld.
The model in full →One signal runs through every program.
Adventures™, PlayLab™, CoinQuest™, Real-World Pathways™, iMPACT Partners™: five different experiences, one continuous thread. A decision made inside any of them feeds the same measure. A spending trade-off in The $100 Week™. A save in CoinQuest™. The choice at the end of a story.
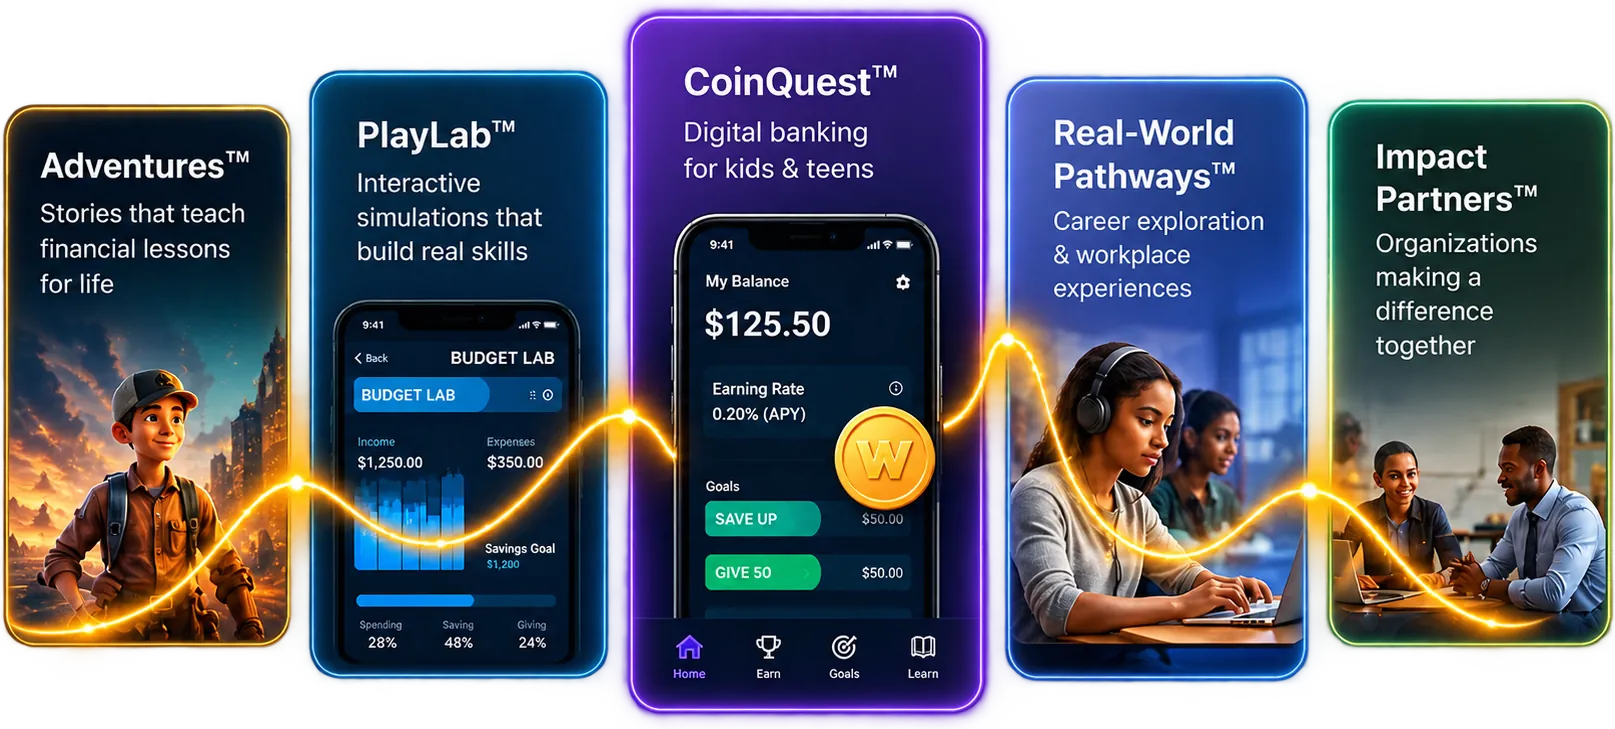
It all arrives here.
One child, one measure, carried across programs and across years. That measure is the FLIQ Score™.
It keeps counting after the lesson ends.
In developmentPractice happens in the simulation; the applied decision happens elsewhere, and the score is designed to see both. A child who reasons about a company in class and is later gifted a share of it has done two different things, and the second counts differently. New sources can be added over time, another program, a partner, a district’s own system, and the score is designed to keep what it means as they join. Whether a score keeps the same meaning across sources and groups is something the planned invariance studies have to show.
Applied credit is capped: the first step outside the simulation moves the number, the tenth barely does, so a score cannot be bought. Partner sources are in development.
Built on evidence. Still being tested.
Three things are true at once, and we keep them separate on purpose: what the FLIQ Score™ is built on, what it is designed to generate, and how far its own validation has come.
Each of the eight dimensions maps to named, peer-reviewed constructs: the national financial-literacy standards (Jump$tart and CEE, 2021), the executive-function literature, and decision science on risk, delay, and reward. The score measures the behavioral expression of that base; it does not claim to measure the biology beneath it.
Every cohort report carries a baseline, a follow-up on the same learners, an implementation-fidelity table, and a longitudinal schedule at 3, 6 and 12 months. That structure is what lets a district, funder, or evaluator treat the output as evidence rather than activity.
Against the five sources of validity evidence in the AERA/APA/NCME Standards, two are partial and three are not yet established. Its design is built to meet the ESSA “demonstrates a rationale” tier; the higher tiers require the studies on the validation roadmap, and we will not claim them first.
Words we use on purpose: designed to measure, evidence-informed, emerging measure. Words we do not use until the studies exist: validated, proven, predictive. The full status is on the validation page.
See what a FLIQ Score™ institutional report contains.
Four documents from one data set: a three-page executive brief, a fourteen-page institutional report, a ten-page technical appendix, and a journal-format research paper. Implementation, behavioral movement, and a twelve-month longitudinal view, each at the depth its reader needs.
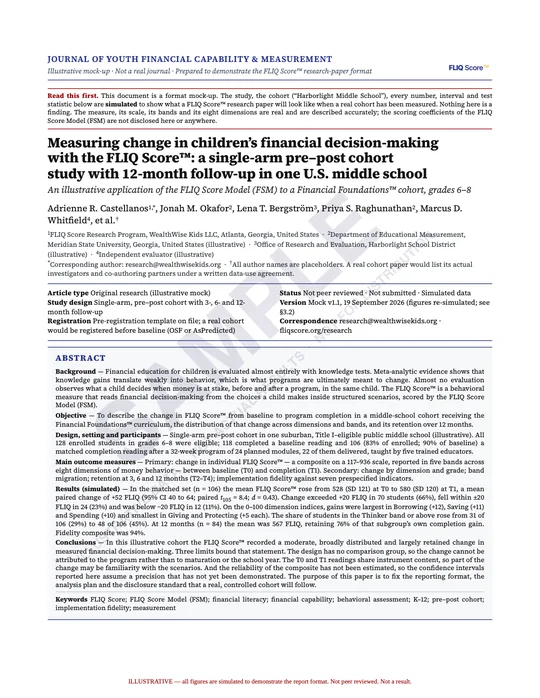
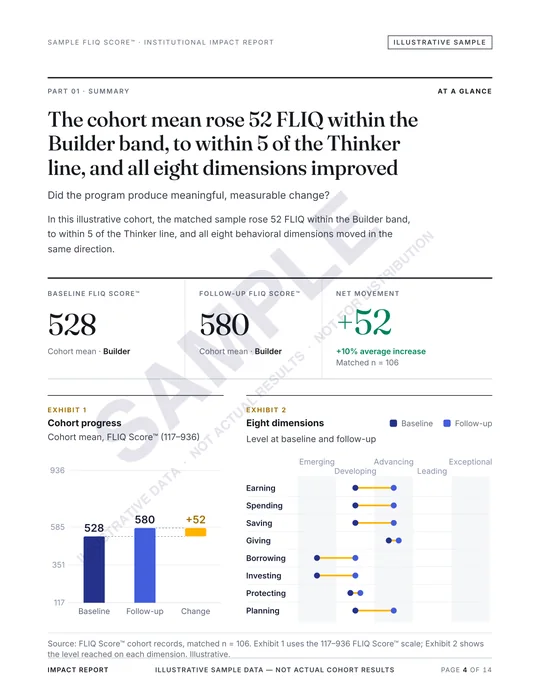
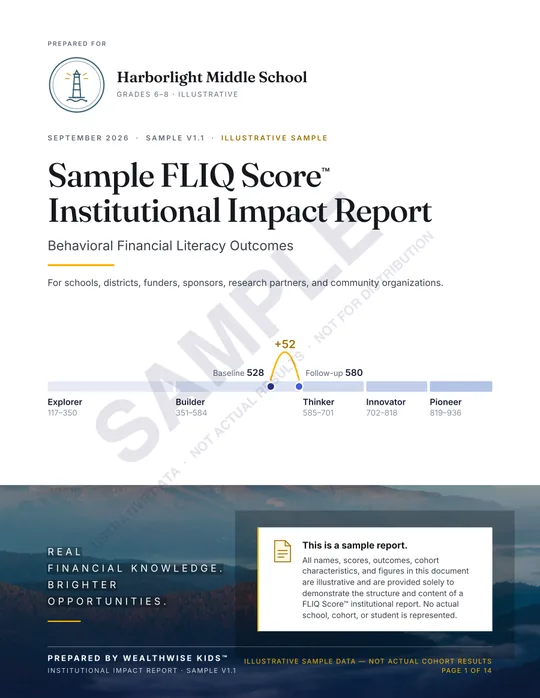
Short on time? Executive brief (PDF · 3 pages) · Evaluating the method? Technical appendix (PDF · 10 pages) · Reading as a researcher? Journal-format research paper (PDF · 6 pages)
Illustrative sample. Every name, score, and result in the documents is invented to show the structure of the report; no real school, cohort, or student is represented. Each file is watermarked SAMPLE and is view-only: printing and copying are disabled.
The Signal.
The moment a child’s choice becomes a number — and a number becomes a signal. A short film on the one signal running through everything.

Four ways forward.
Pick the route that matches your seat. Each one leads to a person, not a form.
Measuring children carries obligations. Read how we handle student data, what we collect, and what we do not do: our data commitments.