
FLIQ Score™ Model
The FLIQ Score™ Model (FSM) is a financial literacy assessment framework that measures how a learner makes financial decisions. It observes choices made in structured scenarios across eight domains, weighs them by how much evidence was observed and by verified applied behavior, and calibrates the result to a single index from 117 to 936, reported in five bands. The index it produces is the FLIQ Score™. The model is read before and after an instructional program and at follow-up, so that change in behavior, rather than recall of facts, is the reported outcome.
The FSM was developed by WealthWise Kids for schools, districts, youth programs, funders and evaluators that must report program outcomes. It is an emerging measure: against the five sources of validity evidence set out in the Standards for Educational and Psychological Testing, two are partially established and three are not yet established,[1] and its validation program is published.
Name
FLIQ /flɪk/ · noun — Financial Literacy Intelligence Quotient: a behavioral measure of how a person decides about money, read from the decisions they make rather than the answers they recall.
FSM /ˌɛf ɛs ˈɛm/ · noun — the FLIQ Score Model: the full measurement system that produces a FLIQ Score.
The name borrows the form of the intelligence quotient and departs from it deliberately: an IQ is conventionally read as a stable property of a person, while a FLIQ Score describes behavior that instruction is expected to change. The unit of the scale is written FLIQ (for example, +158 FLIQ). The name is always written in capitals; “flick” is its spoken form only.
Relation to the intelligence quotient


The intelligence quotient began in French schools. In 1905 the psychologist Alfred Binet, working with the physician Théodore Simon, published the first practical scale of intelligence, developed to identify children who needed additional support in school.[2] In 1912 the German psychologist William Stern proposed dividing a child’s “mental age” by their chronological age, a ratio he called the Intelligenzquotient.[3] Later tests replaced the ratio with a standard score that compares a person with others of the same age, the “deviation IQ” introduced by David Wechsler in 1939.[4]




Research in household finance has since linked cognitive ability to money decisions. Among American adults, higher scores on the mathematical sections of a military aptitude test predicted fewer costly credit mistakes,[5] and in Finland, IQ measured at military induction predicted later participation in the stock market.[6] Among young Americans, financial literacy was found to be low and associated with cognitive ability as well as family background.[7] The same literature shows that ability is not the whole picture. In the Dunedin study, which followed about 1,000 New Zealand children into adulthood, childhood self-control predicted adult wealth and financial trouble even after accounting for intelligence and social class.[8] That finding, that how a person behaves adds to what they know and how able they are, is the premise on which the FSM measures behavior rather than ability.
Binet himself warned against treating intelligence as a fixed quantity, protesting what he called the “brutal pessimism” of that view,[9] and later uses of intelligence tests to rank and sort children were widely criticized.[10] The FLIQ Score™ takes two ideas from this tradition: a single index that summarizes a detailed profile, and reporting in bands that a non-specialist can act on. It departs from the tradition deliberately. It does not measure intelligence or general ability; it describes financial behavior that instruction is designed to change; its scale is not a comparison with other children; and it is never used to rank, label, place or select a child. In that respect it follows Binet’s warning rather than the uses that were later made of his scale.
History

_(8698167143).jpg)
Financial literacy has been defined in many ways, and reviews of the field have called for clearer definitions and measures.[11][12] International bodies have moved toward definitions that include behavior alongside knowledge.[13] Research on outcomes found that interventions focused on knowledge explained very little of later financial behavior, with effects decaying over time,[14] even as better-designed randomized studies showed that financial education can change both knowledge and behavior.[15][16]
The FSM was designed by Michael Olaiya within WealthWise Kids as the measurement layer beneath its financial literacy programs, in response to that gap: programs were routinely measured by recall, while the outcome that mattered was behavior. Its first instrument, The $100 Week™, is a five-day browser simulation that records every decision a learner makes. In 2026 the model received its own home at fliqscore.org, alongside a public Validation Brief (version 2.0), a research program inviting independent studies, and an annotated research library.
Design
Instruments


The FSM follows the logic of evidence-centered design, in which an assessment is built by linking the claims to be made about a learner to the observable evidence that would support them and the tasks that elicit it.[17] Its instruments embed that evidence in activity, an approach known as stealth assessment,[18] and share a premise with behavioral task measures in psychology, which infer a disposition from what a person does rather than what they report, a tradition that includes Mischel’s delay-of-gratification studies with children.[19][20] Decisions are observed in The $100 Week™; CoinQuest™, Financial Foundations™, PlayLab™, Real-World Pathways™ and Adventures™ are designed as further sources.
Measurement cycle
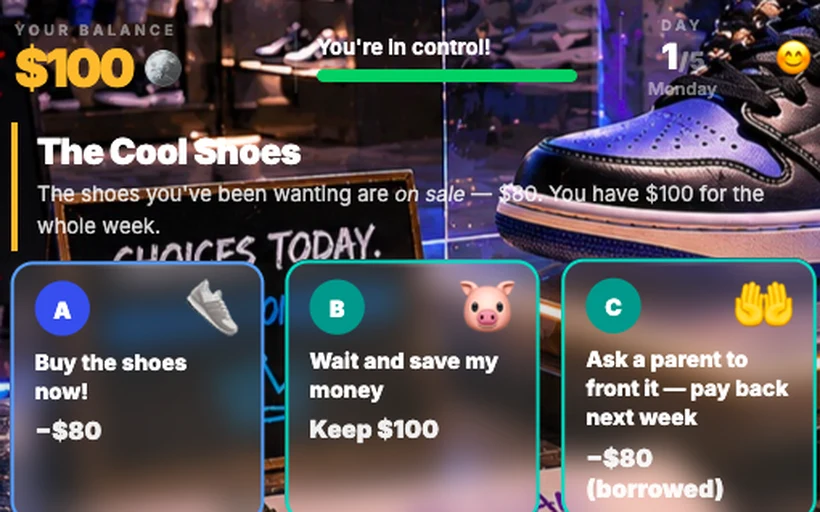
A cohort is read at baseline, before instruction; the program is delivered as written, with no separate test; the same learners are read again after the program on the same scale; and follow-up readings are scheduled at 3, 6 and 12 months. This makes the FSM usable as a financial literacy pre and post assessment while keeping the question of persistence, whether a change held, inside the design.
Longitudinal design
The FSM is a longitudinal measure, not a one-time assessment. The same learners are read repeatedly, and it is the sequence of readings, not any single one, that the model reports. In research terms this is a repeated-measures design: each learner is compared with their own earlier readings rather than with a different group, so change is measured within individuals instead of inferred between groups. One reading gives a level; two give change; follow-up gives persistence. Persistence is the question the design exists to answer, because the effects of financial education have been found to fade: across 201 studies, measured effects on behavior decayed to negligible levels by about twenty months after instruction.[14]The follow-up readings at 3, 6 and 12 months are part of the design; as of 2026 no cohort has yet completed them.
Model structure
The model has six layers. Its structure is published; the calibration layer and all coefficients are withheld, in the manner of instruments that publish method without releasing parameters. The eight domains align with the national standards for personal financial education.[21]
| # | Layer | Function | Disclosure |
|---|---|---|---|
| 1 | Instruments | Environments in which decisions are observed. | Published |
| 2 | Traits | Four behavioral primitives observed in every decision: Impulse Control, Planning Orientation, Risk Awareness, Recovery Behavior. How each is weighted is withheld. | Published |
| 3 | Domains | Earning, Spending, Saving, Giving, Borrowing, Investing, Protecting, Planning. | Published |
| 4 | Confidence | Evidence density per domain; thin evidence is trusted less, never scored as failure. | Published |
| 5 | Nodes | Verified applied behavior outside the simulation, admitted under a written protocol and capped. | Published |
| 6 | Calibration | Mapping of the composite to the 117–936 index and five bands. | Withheld |
Target population
The FSM is designed for children and adolescents, from the early grades through high school, with young adulthood as the horizon of its follow-up readings. It is not designed for adults, whose financial literacy is already measured by established instruments, or for older adults, whose financial risks call for different responses.
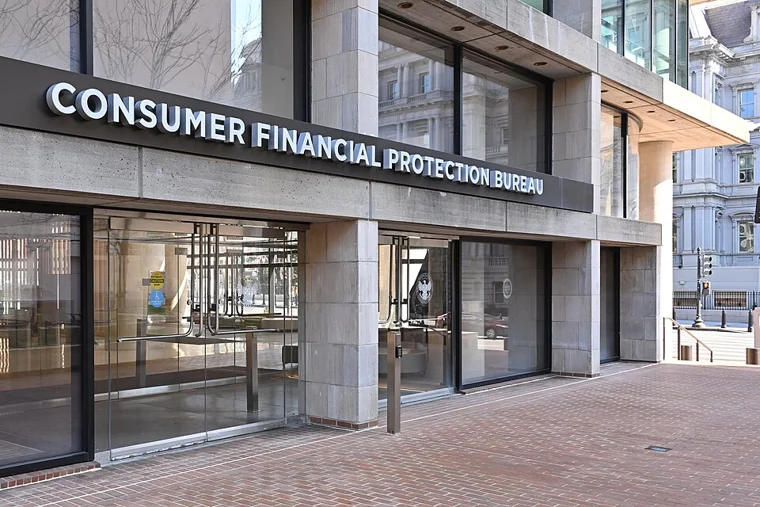
The choice rests on four findings. Money habits form early: a University of Cambridge review for the UK Money Advice Service concluded that the habits underpinning adult money behavior, including delay of gratification and planning, are substantially formed by about age seven.[22] Financial capability develops in stages, which the U.S. Consumer Financial Protection Bureau describes as three building blocks: executive function in early childhood, financial habits and norms in middle childhood, and financial knowledge and decision-making in adolescence and early adulthood.[23] What is established in childhood carries forward: childhood self-control predicted adult financial outcomes in the Dunedin cohort,[8] and young adults whose parents discussed money with them, or who held a bank account as children, showed better financial behavior.[24] And the measurement gap is in childhood. Adults can be assessed with the “Big Three” questions, the CFPB Financial Well-Being Scale and national surveys; for children the available measures are knowledge tests, and none observes behavior.
| Building block | Typical ages | What develops | What the FSM reads |
|---|---|---|---|
| Executive function | 3–5 | Self-control, working memory, planning | Delay and planning behavior in every decision |
| Financial habits and norms | 6–12 | Routines, rules of thumb, family money norms | Repeated choices across the eight domains |
| Financial knowledge and decision-making | 13–21 | Applying knowledge to real choices | Decisions under real trade-offs, and applied behavior |
Building blocks and age ranges from the CFPB youth financial capability framework.[23]
Later life raises a different problem. Financial mistakes follow a U-shape across adulthood: they are most common among young adults and older adults and least common in the early fifties, with the late-life rise linked to declining cognitive function.[25] Those risks call for consumer protection and simpler products more than for a developmental measure.
The strongest objection to measuring in childhood comes from the same review that found knowledge-focused interventions explain little of later behavior. Its authors argue that financial education works best “just in time,” immediately before a real decision such as taking a loan, because lessons learned long in advance fade.[14] The FSM’s longitudinal design is its answer: rather than assume that early learning lasts, it reads the same learners at 3, 6 and 12 months to test whether it does.
Scoring
Every score is placed on one financial literacy measurement scale from 117 to 936. The quantity an institution acts on is the change between two readings of the same learners; a cohort moving from 529 to 687, for example, has moved from the Developing to the Advancing band. Adults see the number, the change and an eight-domain profile. Learners see only a badge and their own growth, never a comparison with a classmate. A learner observed making too few decisions is reported as “insufficient evidence” rather than assigned a low score.
| Band | Learner badge | Range (FLIQ) |
|---|---|---|
| Emerging | Explorer | 117–350 |
| Developing | Builder | 351–584 |
| Advancing | Thinker | 585–701 |
| Leading | Innovator | 702–818 |
| Exceptional | Pioneer | 819–936 |
Applications
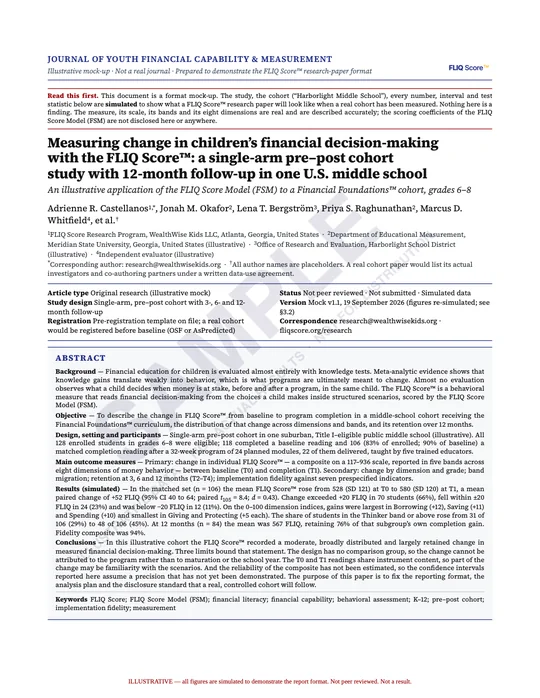
The FSM is used for program evaluation, cohort-level pre and post reporting of financial literacy program outcomes, and instructional planning by domain. A cohort report set comprises a three-page executive brief, a fourteen-page institutional report (primary outcome, eight-domain profile, implementation fidelity and a twelve-month longitudinal view), a ten-page technical appendix, and a journal-format research paper; sample reports are published with illustrative data. Research partners may receive de-identified, event-level data under a written data-use agreement. The model is not used for grading, ranking, placement, selection, eligibility decisions, or comparison across grade bands. Youth financial capability is described in the consumer-protection literature as more than knowledge, including executive function and financial habits,[23] which is the ground the model is built to observe.
Reliability and validity
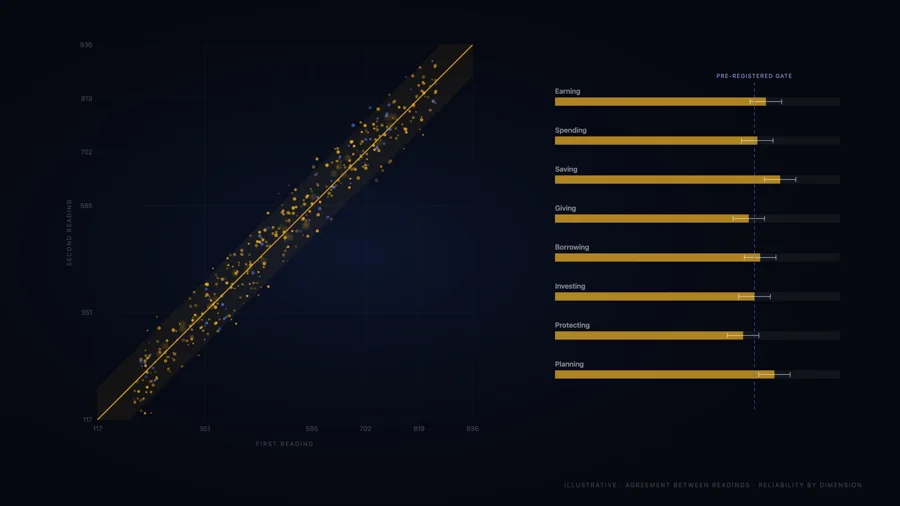
Validity is evaluated against the five sources of evidence in the Standards: test content, response processes, internal structure, relations to other variables, and consequences of use.[1] As of 2026, test content and response processes are partially established; the other three are not yet established. Reliability targets are pre-registered: internal consistency (McDonald’s omega) of .70 or above, and test–retest agreement of .65 or above at two to four weeks, to be estimated on a consented norming sample of roughly 400 to 600 learners stratified by age band and household income. Item response theory has been applied to financial knowledge scales,[26] and alternate forms calibrated from one item bank are planned so that baseline and follow-up need not share an instrument. Establishing that the FLIQ Score detects the change that well-designed financial education produces[15] is the work of the research program, whose results enter the Validation Brief whatever they show.
Limitations and criticism
The FSM is new, and the questions below are open. Each is stated with the part of the design or research program that addresses it; none is yet resolved by published evidence.
| Limitation | Concern | Response in the design | Status (2026) |
|---|---|---|---|
| Generalizability | Used only in the U.S., in English, with small groups | Stratified norming study; invariance testing across groups | Planned |
| Socioeconomic context | Circumstance can be read as low capability | Change measured within each learner; household context modeled | Designed; untested |
| Cultural context | One culture's norms could penalize others | Giving as its own domain; bias studies by culture and language | Planned |
| Simulated vs. real decisions | Choices without stakes can overstate behavior | Applied-behavior layer; 3-, 6- and 12-month follow-up | Designed; untested |
| Independence | Developer builds, sells and evaluates | Independent, pre-registered studies published regardless of result | Recruiting first partner |
| Instrument limitations | Same form before and after; no age norms; reliability unestimated | Alternate forms; norming and reliability studies | Planned |
| Wider debate | Education may not substitute for regulation | Behavioral evidence to test the claim either way | Open |
Generalizability
As of 2026 the instrument has been used only in the United States, in English, and with small groups of learners. It has not been tested across countries, languages, school systems or the full K–12 age range, and its scale has not been normed on a representative sample. Findings from one population cannot be assumed to hold in another; the Standards treat evidence of validity as specific to the population and use for which it was gathered.[1] The planned norming study stratifies by age band and household income, and measurement invariance testing across groups is on the research agenda.
Socioeconomic context
A child’s financial decisions are shaped by circumstance as well as capability. A learner whose family has no bank account, or for whom saving is not a realistic option, may make choices that a behavioral measure reads as weaker but that are sensible given their situation. Financial literacy among young people is already known to vary with family background,[7] so a measure that ignores context risks encoding disadvantage as a deficit. The same pattern appears internationally: across OECD countries in PISA 2022, fifteen-year-olds from the most advantaged quarter of households outscored those from the least advantaged quarter by 87 points in financial literacy.[34] The FSM’s response is to report change within the same learner rather than rank learners against each other, and to treat household context as a variable the model must account for rather than a trait of the child.
Cultural context
What counts as a sound money decision differs between families and cultures. Children learn about money largely from their families,[27] and practices such as sharing income with relatives, contributing to a household, or giving to a community may reflect responsibility rather than poor saving. A measure built on one set of norms could penalize others. The eight domains include Giving alongside Saving, and differential item functioning by culture and language is among the studies the research program invites.
Simulated and real decisions
Most of the FSM’s evidence comes from decisions made in a simulation, and choices made without real consequences can differ from choices made with real money. In economics this gap is known as hypothetical bias, and a meta-analysis found that stated choices tend to overstate what people actually do.[28] The model’s applied-behavior layer and its follow-up readings are designed to test how far simulated behavior carries into real decisions, but that transfer has not yet been demonstrated.
Independence

The FSM was developed by WealthWise Kids, which also offers the programs the measure is used to evaluate. That is a conflict of interest: an organization that both teaches and measures has a reason to find that its teaching works. The concern is documented: in education research, evaluations commissioned by a program’s developer report larger average effects than independent evaluations,[29] and effects are also larger when the outcome is measured with an instrument made by the researchers themselves.[30] Both conditions apply to the FSM today. The research program is structured to reduce them: studies are designed and analyzed by independent partners, pre-registered where possible, and published whatever they show, including null or unfavorable results. No independent study has yet been completed.
Instrument limitations
Baseline and follow-up currently use the same instrument, so familiarity may contribute to measured change; alternate forms calibrated from one item bank are planned. The scale has not been normed by age, and its reliability has not yet been estimated.
The wider debate
Some scholars argue that financial education is an ineffective substitute for consumer protection and regulation.[31] The FSM does not settle that question, but a measure of behavior is one way to test it with evidence rather than assume the answer, in either direction.
Comparison with other measures

Financial literacy has most often been measured with knowledge questions, from the three-question “Big Three” used in adult surveys[32][33] to the PISA assessment of fifteen-year-olds,[34] and with self-report scales such as the CFPB Financial Well-Being Scale.[35] The FSM measures a different construct.
Knowledge tests report what a student can answer; self-report scales report how a person describes their situation. Neither observes a decision being made. The FSM places its evidence in the decision itself and reads it more than once, which is what allows it to report change and persistence rather than a single level.
| Knowledge test or quiz | Survey or questionnaire | FLIQ Score Model | |
|---|---|---|---|
| Construct | Knowledge of facts and terms | Self-reported attitudes and habits | Observed decisions and how they are made |
| Timing | Once, usually end of unit | Once, or before and after | Baseline, post; 3, 6, 12 months |
| Output | Percentage correct | Scale score | Index 117–936, 5 bands, 8-domain profile |
| Institutional report | Coverage and completion | Perceptions | Behavioral change, fidelity, persistence |
| Learner sees | A grade | Nothing | A badge and own growth; never a rank |

The FLIQ Score today
As of 29 September 2026.
As of 2026 the FSM is in its deployment stage. Its first instrument, The $100 Week™, is live and free to use in any web browser, and has been run in classrooms and community youth programs alongside the Financial Foundations™ curriculum. A complete sample report set shows what an institution receives, the Validation Brief (version 2.0) states the measure’s current standing, and the research program is recruiting its first independent partner.
No cohort has yet completed the full measurement cycle, and no outcome figures have been published. The first measured cohorts, read at baseline, after the program and at follow-up, are being organized with schools and youth programs; their results will be reported against the pre-registered standards described above, whatever they show.
“I used a portion of WealthWise Kids’ Financial Foundations curriculum with my students and also tried The $100 Week simulation. The activities gave them practical situations to discuss and helped connect financial decisions to everyday life. I appreciated having a way to guide the conversation while giving students room to think through their own choices.”
Data protection
Reports are prepared for adult decision-makers and contain no student names or rankings. Research and data access run under written data-use agreements, institutional review board or equivalent review, and guardian consent where required; the Family Educational Rights and Privacy Act (FERPA) and the Children’s Online Privacy Protection Act (COPPA) govern where they apply. The model’s parameters and item content are held as trade secrets.
See also
- FLIQ Score™
- Validation status of the FLIQ Score
- Research Foundations
- Research Library on financial literacy in childhood
- Sample institutional reports
- About the FLIQ Score
References
- American Educational Research Association, American Psychological Association, & National Council on Measurement in Education (2014). Standards for Educational and Psychological Testing. Washington, DC: AERA. Source. Research Library: FL 401.
- Binet, A.; Simon, T. (1905). “Méthodes nouvelles pour le diagnostic du niveau intellectuel des anormaux.” L’Année psychologique 11: 191–244. doi:10.3406/psy.1904.3675.
- Stern, W. (1912). Die psychologischen Methoden der Intelligenzprüfung und deren Anwendung an Schulkindern. Leipzig: J. A. Barth. Source.
- Wechsler, D. (1939). The Measurement of Adult Intelligence. Baltimore: Williams & Wilkins. doi:10.1037/10020-000.
- Agarwal, S.; Mazumder, B. (2013). “Cognitive abilities and household financial decision making.” American Economic Journal: Applied Economics 5 (1). doi:10.1257/app.5.1.193.
- Grinblatt, M.; Keloharju, M.; Linnainmaa, J. (2011). “IQ and stock market participation.” Journal of Finance 66 (6). doi:10.1111/j.1540-6261.2011.01701.x.
- Lusardi, A.; Mitchell, O. S.; Curto, V. (2010). “Financial literacy among the young.” Journal of Consumer Affairs 44 (2). doi:10.1111/j.1745-6606.2010.01173.x.
- Moffitt, T. E.; Arseneault, L.; Belsky, D.; et al. (2011). “A gradient of childhood self-control predicts health, wealth, and public safety.” Proceedings of the National Academy of Sciences 108 (7). doi:10.1073/pnas.1010076108. Research Library: FL 204.
- Binet, A. (1909). Les idées modernes sur les enfants. Paris: Flammarion. Source.
- Gould, S. J. (1981). The Mismeasure of Man. New York: W. W. Norton. Source.
- Remund, D. L. (2010). “Financial literacy explicated: The case for a clearer definition in an increasingly complex economy.” Journal of Consumer Affairs 44 (2). doi:10.1111/j.1745-6606.2010.01169.x. Research Library: FL 103.
- Huston, S. J. (2010). “Measuring financial literacy.” Journal of Consumer Affairs 44 (2). doi:10.1111/j.1745-6606.2010.01170.x. Research Library: FL 102.
- OECD (2020). Recommendation of the Council on Financial Literacy. OECD/LEGAL/0461. Source. Research Library: FL 106.
- Fernandes, D.; Lynch, J. G.; Netemeyer, R. G. (2014). “Financial literacy, financial education, and downstream financial behaviors.” Management Science 60 (8). doi:10.1287/mnsc.2013.1849. Research Library: FL 302.
- Kaiser, T.; Lusardi, A.; Menkhoff, L.; Urban, C. (2022). “Financial education affects financial knowledge and downstream behaviors.” Journal of Financial Economics 145 (2). doi:10.1016/j.jfineco.2021.09.022. Research Library: FL 301.
- Kaiser, T.; Menkhoff, L. (2020). “Financial education in schools: A meta-analysis of experimental studies.” Economics of Education Review 78. doi:10.1016/j.econedurev.2019.101930. Research Library: FL 304.
- Mislevy, R. J.; Steinberg, L. S.; Almond, R. G. (2003). “On the structure of educational assessments.” Measurement: Interdisciplinary Research and Perspectives 1 (1). doi:10.1207/S15366359MEA0101_02. Research Library: FL 408.
- Shute, V. J.; Ventura, M. (2013). Stealth Assessment: Measuring and Supporting Learning in Video Games. Cambridge, MA: MIT Press. Source. Research Library: FL 407.
- Lejuez, C. W.; Read, J. P.; Kahler, C. W.; et al. (2002). “Evaluation of a behavioral measure of risk taking: The Balloon Analogue Risk Task (BART).” Journal of Experimental Psychology: Applied 8 (2). doi:10.1037/1076-898X.8.2.75. Research Library: FL 411.
- Mischel, W.; Shoda, Y.; Rodriguez, M. L. (1989). “Delay of gratification in children.” Science 244 (4907). doi:10.1126/science.2658056. Research Library: FL 202.
- Jump$tart Coalition; Council for Economic Education (2021). National Standards for Personal Financial Education. Source. Research Library: FL 105.
- Whitebread, D.; Bingham, S. (2013). Habit Formation and Learning in Young Children. University of Cambridge for the Money Advice Service. Source. Research Library: FL 201.
- Consumer Financial Protection Bureau (2016). Building Blocks to Help Youth Achieve Financial Capability. Source. Research Library: FL 205.
- Kim, J.; Chatterjee, S. (2013). “Childhood financial socialization and young adults’ financial management.” Journal of Financial Counseling and Planning 24 (1). Source. Research Library: FL 206.
- Agarwal, S.; Driscoll, J. C.; Gabaix, X.; Laibson, D. (2009). “The age of reason: Financial decisions over the life cycle and implications for regulation.” Brookings Papers on Economic Activity 2009 (2). doi:10.1353/eca.0.0067. Research Library: FL 607.
- Knoll, M. A. Z.; Houts, C. R. (2012). “The Financial Knowledge Scale: An application of item response theory to the assessment of financial literacy.” Journal of Consumer Affairs 46 (3). doi:10.1111/j.1745-6606.2012.01241.x. Research Library: FL 409.
- Gudmunson, C. G.; Danes, S. M. (2011). “Family financial socialization: Theory and critical review.” Journal of Family and Economic Issues 32 (4): 644–667. doi:10.1007/s10834-011-9275-y. Research Library: FL 207.
- Murphy, J. J.; Allen, P. G.; Stevens, T. H.; Weatherhead, D. (2005). “A meta-analysis of hypothetical bias in stated preference valuation.” Environmental and Resource Economics 30 (3): 313–325. doi:10.1007/s10640-004-3332-z.
- Wolf, R.; Morrison, J.; Inns, A.; Slavin, R.; Risman, K. (2020). “Average effect sizes in developer-commissioned and independent evaluations.” Journal of Research on Educational Effectiveness 13 (2): 428–447. doi:10.1080/19345747.2020.1726537.
- Cheung, A. C. K.; Slavin, R. E. (2016). “How methodological features affect effect sizes in education.” Educational Researcher 45 (5): 283–292. doi:10.3102/0013189X16656615.
- Willis, L. E. (2011). “The financial education fallacy.” American Economic Review 101 (3). doi:10.1257/aer.101.3.429. Research Library: FL 807.
- Lusardi, A.; Mitchell, O. S. (2011). “Financial literacy around the world: An overview.” Journal of Pension Economics and Finance 10 (4). doi:10.1017/S1474747211000448. Research Library: FL 107.
- Lusardi, A.; Mitchell, O. S. (2014). “The economic importance of financial literacy: Theory and evidence.” Journal of Economic Literature 52 (1). doi:10.1257/jel.52.1.5. Research Library: FL 101.
- OECD (2024). PISA 2022 Results (Volume IV): How Financially Smart Are Students? Paris: OECD Publishing. doi:10.1787/5a849c2a-en. Research Library: FL 403.
- Consumer Financial Protection Bureau (2015). Measuring Financial Well-Being: A Guide to Using the CFPB Financial Well-Being Scale. Source. Research Library: FL 405.
Further reading
- Amagir, A.; Groot, W.; Maassen van den Brink, H.; Wilschut, A. (2018). “A review of financial-literacy education programs for children and adolescents.” Citizenship, Social and Economics Education 17 (1). doi:10.1177/2047173417719555
- Batty, M.; Collins, J. M.; Odders-White, E. (2015). “Experimental evidence on the effects of financial education on elementary school students’ knowledge, behavior, and attitudes.” Journal of Consumer Affairs 49 (1). doi:10.1111/joca.12058
- Collins, J. M.; Odders-White, E. (2015). “A framework for developing and testing financial capability education programs targeted to elementary schools.” Journal of Economic Education 46 (1). doi:10.1080/00220485.2014.976325
- Frisancho, V. (2023). “Is school-based financial education effective? Immediate and long-lasting impacts on high school students.” The Economic Journal 133 (651). doi:10.1093/ej/ueac084
- Hastings, J. S.; Madrian, B. C.; Skimmyhorn, W. L. (2013). “Financial literacy, financial education, and economic outcomes.” Annual Review of Economics 5. doi:10.1146/annurev-economics-082312-125807
- Kaiser, T.; Menkhoff, L. (2017). “Does financial education impact financial literacy and financial behavior, and if so, when?” World Bank Economic Review 31 (3). doi:10.1093/wber/lhx018
- Miller, M.; Reichelstein, J.; Salas, C.; Zia, B. (2015). “Can you help someone become financially capable? A meta-analysis of the literature.” World Bank Research Observer 30 (2). doi:10.1093/wbro/lkv009
- OECD (2020). PISA 2018 Results (Volume IV): Are Students Smart about Money? Paris: OECD Publishing. doi:10.1787/48ebd1ba-en
- Urban, C.; Schmeiser, M.; Collins, J. M.; Brown, A. (2020). “The effects of high school personal financial education policies on financial behavior.” Economics of Education Review 78. doi:10.1016/j.econedurev.2018.03.006
External links
- Official website
- The Signal (2026), a short film on the FLIQ Score
- FLIQ Score validation status
- FLIQ Score research program
- FLIQ Score in Wikidata (Q141501511)
- Jump$tart National Standards for Personal Financial Education
- Consumer Financial Protection Bureau: youth financial education
- Council for Economic Education: Survey of the States
- FINRA Investor Education Foundation: National Financial Capability Study
- Standards for Educational and Psychological Testing